
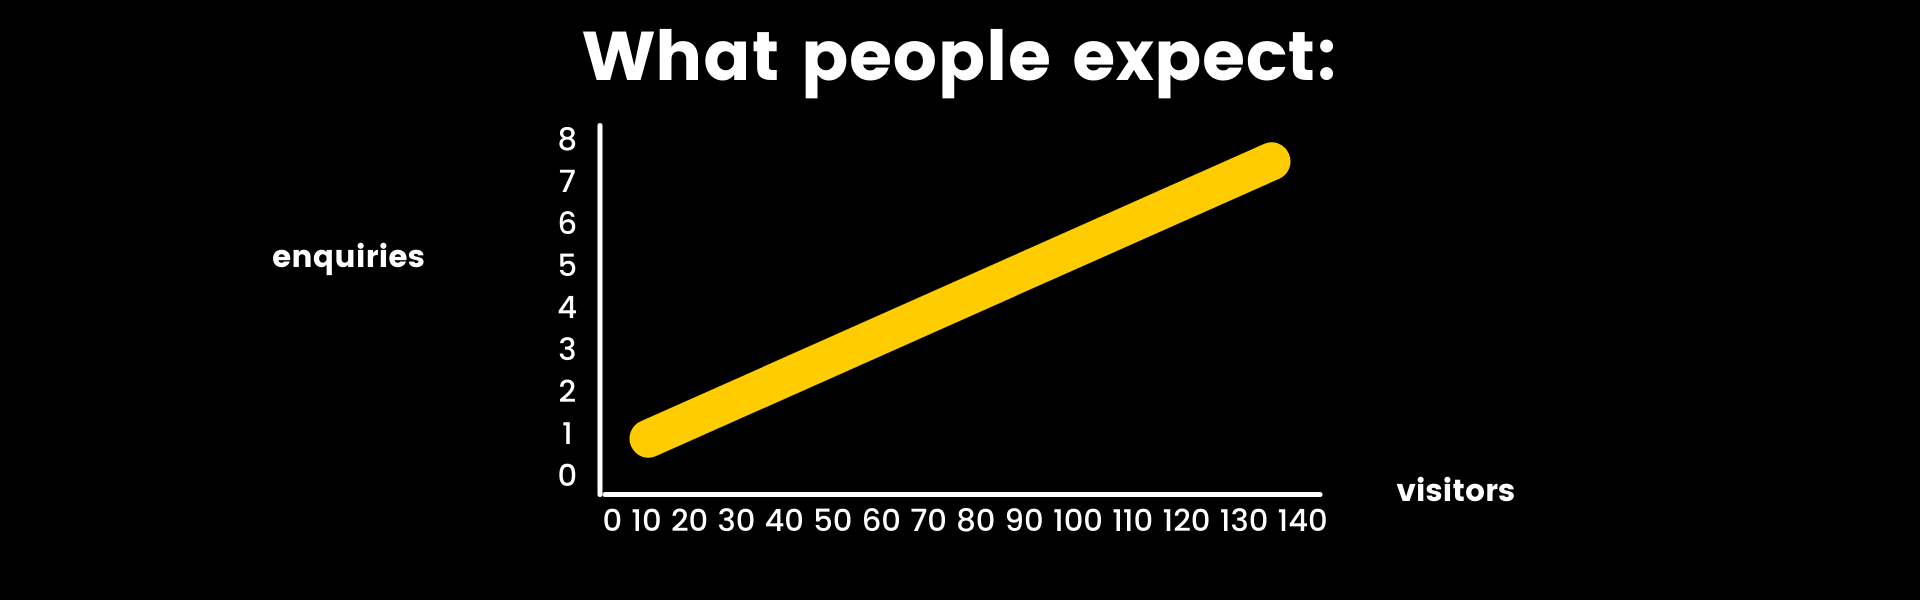
One of the most common misconceptions I’ve seen in businesses is the idea that sales conversion rates are linear. If for example your PPC campaign is getting 4 enquiries for every 400 visits, then common wisdom is that when you up the budget and get 4000 people onto your landing page you’ll have 40 enquiries. It’s the sort of thing that makes sense on paper but in reality, the results could be both up and down…and so I thought I’d try and explain why.
The effect of more data
As a general rule of thumb, the more data we have on how targets respond to our marketing, the smarter we can be about it. Data can help us to learn the best time to send an email or post social media content, it can tell us which segments respond to which messages and so on and so on. If we were doing a PPC campaign then over time the algorithm would also get smarter and show our ads to more and more relevant audiences. As you might imagine this can have a very positive impact on our sales funnel, but may also be the cause of fluctuation in the short term. This should hopefully mean that less people have to enter our funnel to get the same or better results.
The effect of more visitors
While data can help us to optimise our campaign and improve our conversion rate, as we expand our audience… the opposite should happen to our sales funnel. It’s completely natural that as we expand our reach, we are more likely to encounter people who aren’t interested. As visitor numbers rise in the short-term you should see bounce-rates also go up, and while your enquiry rate may be the same, your conversion rate will, of course, go down. Think of it like this…If you had a Rock Show, on a music TV channel you might only be able to reach a few thousand people but they are very likely to engage. You could take the same show and stick it on BBC 2, Your audience might be 100 times bigger but the people who would enjoy the show might only be a little more than what you’re getting now.
The ugly truth about attribution
While we would all like to think that people will see our landing pages, be amazed at what they see, and fill in an enquiry form…we all know this isn’t the case. The buying process isn’t linear and so why would our sales funnel? Someone might click on an ad, come back the next day to your website but because they’ve deleted their history, you’ve no idea. Even with today’s more complex tracking systems, the truth is still somewhat fuzzy. If you normally get 4 enquiries through your website a month, and that number goes up when you’re running a PPC campaign for example, the events are likely to be linked even where you may not have direct evidence.
The problem with ‘hot’ leads
A lot of the time the reason that our sales funnels fluctuate is because of the definitions attached to it. Quite often people will tag their sales funnels with ‘good leads’ or ‘hot leads’ and the obvious problem with this is that, even where you may have a definition, most of these terms are subjective in nature. As we all know sometimes the leads that look like a waste of the time will convert and the promising leads will come to nothing months later. Another issue is that sometimes our marketing will generate leads that are quite obviously bad and the sales team will want to exclude these from any stats, but this also can skew your results. In order to properly understand your sales funnel, its important to remember that you don’t really have any control over the quality of leads generated (especially inbound) and its better to have less stages with correct numbers. Even if that’s as simple as contacts created, leads created, clients created.
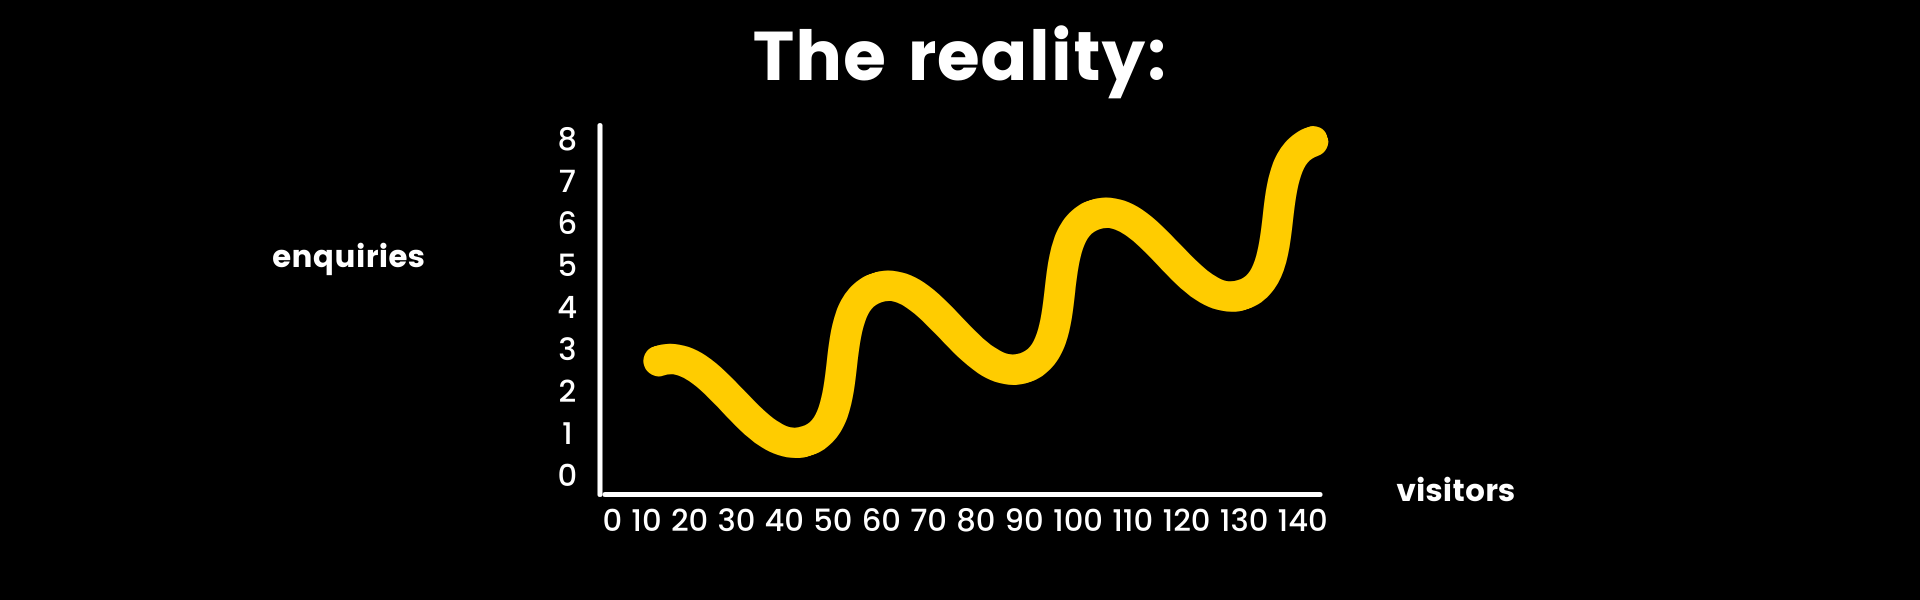
So what should your sales funnel look like?
If we were to graph a successful sales conversion rate, what we would see would be step-like. The overall graph would be going up over time but as it did so there would be little rises and falls. As we grew our audience our conversion rate would go down, until we had sorted through this batch of customers and found the people to who our business is relevant. The severity of these rises and falls will depend very much on our activity. We might attend an event where we make lots of new contacts, but it might turn out that they aren’t very senior for example. So there would always be an shifting scale in terms of how many people were coming into our pipeline, showing interest and ultimately being converted to customers.
Conclusion
There are lots of little elements that all need to be optimised in order to get your sales funnel working. It is not unusual at all for your conversion rate to fluctuate depending on your activity, but the overall graph needs to be pointed in an upwards trajectory. While it will always be difficult to understand future performance, this is not to say however, that expected sales performance will always be a case of ‘try and see.’ Its always a good idea to try things in a small and self-contained way to see if they work and then invest more time and energy afterwards.
